How to Improve OEE

Three Methodologies for Improving OEE in Manufacturing
The three most popular manufacturing improvement methodologies are Lean Manufacturing, Six Sigma, and Theory of Constraints. OEE was developed as part of Lean Manufacturing – specifically as part of the powerful and holistic improvement process known as TPM (Total Productive Maintenance).
All of these methodologies have a great deal to offer for manufacturing improvement. None of these methodologies are easy. As a result, we are often asked – is there a way to get started while we put a comprehensive program in place? The answer is yes.
A Fourth Methodology: IDA
This page introduces a simple and universal methodology for driving any improvement activity and shows you how to apply it to OEE. The methodology is known as IDA (Information, Decision, Action).

IDA emphasizes three factors:
- Information: Information is the foundation and starting point of IDA. Excellent information (i.e., accurate, relevant, and easy-to-understand) is a precondition for effective decision-making.
- Decision: Decisions are the pivot between Information and Action. It is the moment in time when Information is reviewed and a course of Action is decided.
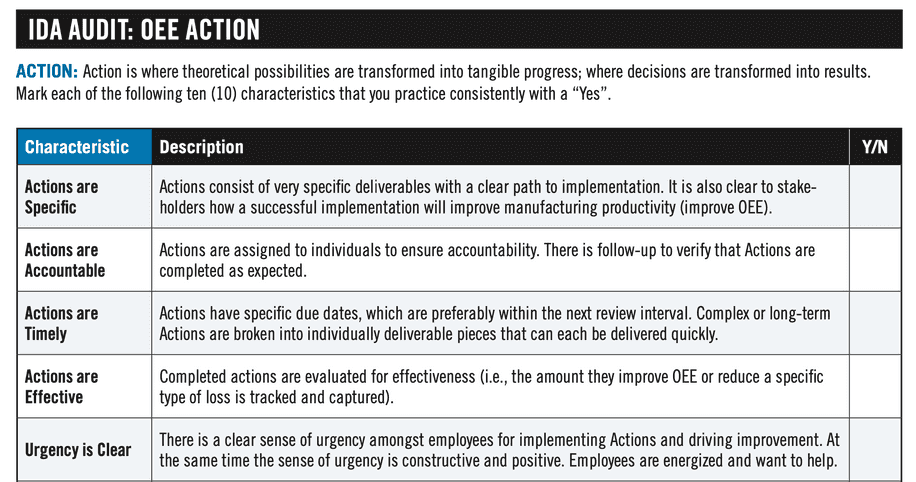
- Action: Action is where theoretical possibilities are transformed into tangible progress; where Decisions are transformed into Results.
IDA is simple and universal. You may have noticed that the equation looks a lot like OEE. Three factors are multiplied together to get an answer:
Availability × Performance × Quality = OEE
Information × Decision × Action = Result
Just like OEE, all three factors are needed to get a good result. Here’s an example. Imagine you are a pilot and it's your job to safely fly passengers from Chicago to London. In each of the following three scenarios there is an IDA problem that will prevent you from meeting your objective:
- The gauges are inaccurate or broken (Information problem)
- The gauges are accurate but you don’t use them to chart your course (Decision problem)
- The gauges are accurate and you look at them; but you don't bother to make any adjustments to the flight controls (Action problem)
Like a chain, IDA is only as strong as its weakest link. All three factors (Information, Decision, and Action) must be present and in balance to achieve optimal results.
IDA is simple enough to be understood by all employees and broad enough to serve as a core tool for forwarding the goals of the business. By establishing behaviors that optimize the inputs (Information, Decision, and Action), the outputs (Results) will take care of themselves.
Information
Information is the foundation for effective decision-making. The goal is to generate accurate and relevant data that is available to all stakeholders.
Identify the Constraint
What Do We Do?
The first step is to make sure you are collecting information at the right place in the manufacturing process. Whether you’re filling bottles, packing boxes, stamping metal, or assembling buses, there will always be a single step or machine that governs your throughput. This step is the constraint.
The performance of the constraint is the performance of the entire manufacturing process because it’s the slowest step. To identify the constraint, look for the step that has the lowest throughput. If the line is rated to run at only one speed, then the constraint is the equipment that does the primary work.

Example
You work at the Bubbly Beer Company, which has three bottling lines. The equipment on each bottling line is:
- A glass unscrambler (for unloading pallets of clean fill-ready glass bottles)
- A filler/crowner (for sealing Bubbly Beer in bottles)
- A labeler (to put labels on the bottles)
- A case packer (to put the bottles in cardboard boxes)
- A palletizer (to load the cases of beer onto pallets for shipping)
After reviewing the maximum speed of every machine, the team has identified that the filler is the slowest piece of equipment (the constraint). This is typical for a bottling line. The team decides to measure losses at the filler.
Capture Loss Information
What Do We Do?
The gold standard for measuring manufacturing losses is OEE, with a breakdown of OEE Losses into the Six Big Losses and a further breakdown of Availability Losses into Reasons.
For manufacturing processes with multiple steps, it is important to distinguish between:
- Internal Stops (the constraint is down because of something happening at the constraint)
- External Stops (the constraint is down because of something happening upstream or downstream)
By measuring losses on the constraint, and from the perspective of the constraint, you can prioritize OEE improvement activities on the equipment that most affects line throughput.
Example
The Operations Director, Mario, has past experience with OEE and wants to start simple – with manual data capture. He also knows that it is better to capture less information really well than more information poorly. So, Bubbly Beer starts by capturing the following loss information:
- Equipment Failure: Any unplanned stop longer than five minutes is recorded on a tick sheet with ten (10) reasons for internal stops, plus an additional reason for starved (by upstream equipment) and for blocked (by downstream equipment).
- Setup and Adjustments: Each changeover is recorded from the last bottle of one flavor to the first bottle of the next flavor.
- Performance Loss: Mario knows it is very difficult to manually track the difference between Minor Stops and Reduced Speed and he doesn’t want operators distracted by this – so instead he decides that performance loss will be calculated (from Ideal Cycle Time, Total Parts, and Run Time).
- Production Rejects: The operators track defects that most affect throughput at the constraint (defects at the constraint step or later) by subtracting the count of bottles going into the filler from the number of bottles shipped (as calculated from palletized cases).
- Startup Rejects: The operators maintain a separate defect count during startup and after each changeover.
After two weeks of capturing loss information the team has a good understanding of the filler losses. They also know that their OEE is 54.65%. Plenty of room to improve!
Decision
Decisions are the pivot between Information and Action. It is the moment in time when Information is reviewed and a course of Action is decided. This is where we make decisions such as:
- What will we change?
- Over what time period?
- Who will be responsible for the change?
We recommend working on two week improvement cycles. It’s long enough to make significant changes and short enough to maintain a sense of focus and urgency.
Pick a Top Loss
What Do We Do?
One of the fastest ways to improve is to relentlessly focus on top losses. In other words, focus your attention on the smallest set of improvement actions that are likely to yield big results.
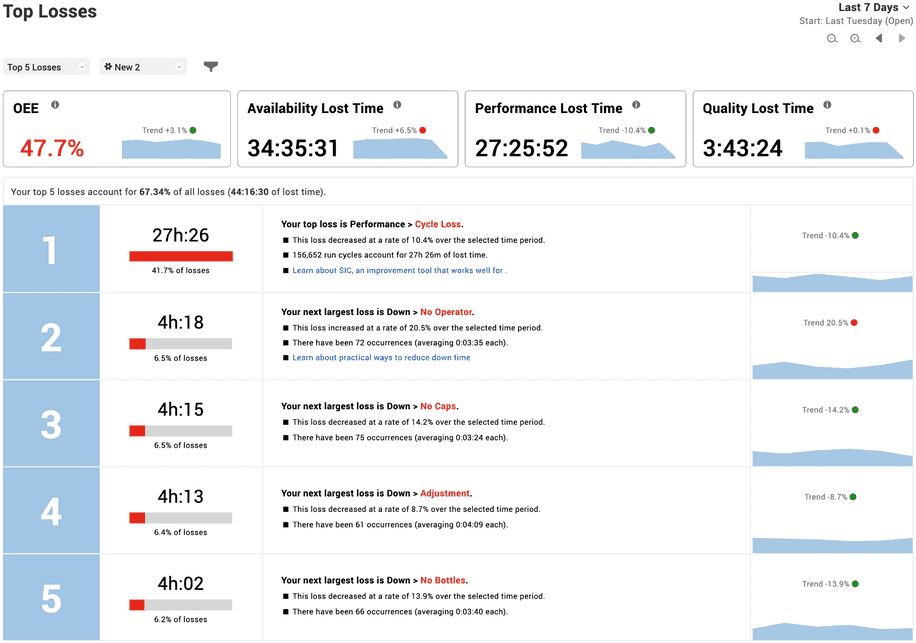
Pick the largest loss where:
- Your team has ideas on actions that they can take.
- Minimal external resources are required.
- Action can be taken straightaway.
Example
The Bubbly Beer production team meets to review their top losses, which they have compiled into a simple spreadsheet:
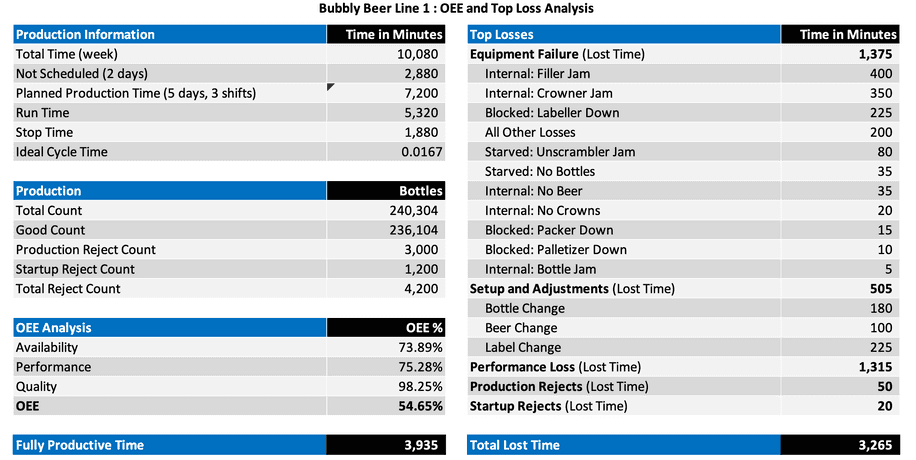
OEE Performance is considerably lower than they expected; they’ve lost 1,315 minutes of production time to small stops and slow cycles. This is almost as much as their total loss caused by Equipment Failure and Setup and Adjustments.
Frank, one of the more experienced operators, mentions that the filler is frequently stopped for a minute or two because of jams. Better yet – he shares some observations and ideas for reducing the number of jams. A consensus is quickly reached – the team wants to address Performance Loss.
Decide Countermeasures
What Do We Do?
The next step is to select one or more countermeasures.
- Start by brainstorming. The purpose of brainstorming is to expand the world of possibilities. Record every idea and make no judgments as to practicality. For now – every idea is a good idea.
- Finish by refining. The purpose of refining is to reduce the world of possibilities. Hone the list to the most promising set of countermeasures that can be completed in the selected improvement cycle timeframe (nominally two weeks).
Make sure each countermeasure is “owned” by one team member and that everyone has committed to completing their work within the selected timeframe.
Example
The production team holds a 30-minute brainstorming session and comes up with seven ideas for reducing Performance Loss:
- Restore filler to original condition (5S blitz, lubrication activity, and wear part replacement).
- Set a fixed speed for each product (as opposed to operators arbitrarily setting the speed).
- Put a light on the filler that indicates when running slower than the fixed speed.
- Check setup marks for each product to improve precision.
- Check the filler maintenance plan and ensure that essential maintenance is completed as scheduled on an ongoing basis.
- Add a cooling system to the capex plan to chill the product before bottling.
- Review performance loss every two (2) hours to better capture reasons for performance loss.
The team also realizes that it doesn’t have any hard data to explain performance loss on the filler. So it adds an eighth point:
- Put a tick sheet on the constraint to capture the top 10 reasons for small stops and slow cycles, so that operators can tick each loss as it occurs (to get more detailed information).
The team commits to completing items 1, 3, 4, and 8 over the next two weeks. One member of the team takes on responsibility (“ownership”) for each of the four countermeasures.
Action
Action is where theoretical possibilities are transformed into tangible progress; where Decisions are transformed into Results. Apply Decisions quickly and consistently to create tangible progress.
Implement Countermeasures
What Do We Do?
This is where Actions are carried out – and change is created.
To maximize the impact of your Actions, it’s a good idea to make sure all resources are aligned before embarking on any significant changes. For example:
- Brief and educate team members (so everyone is on the same page)
- Task-out the improvement cycle (fill in details as needed)
- Touch base with scheduling (to allocate time to work on the equipment)
- Purchase any needed materials (such as replacement parts)
- Actively lead the project (stay positive and motivated, focus on the plan, and celebrate wins along the way)
Example
Allen, the shift supervisor, leads a 15-minute meeting with key stakeholders to review the plan of improvements. He explains how Performance Loss has affected production and how they are working to increase the productivity of their existing equipment so they can introduce Bubbly Beer to several new test markets without major capital expenditures.
Mario reserves an hour each morning for a daily Gemba walk with Allen to convey top-level support for their project.
Allen then leads another 15-minute meeting with key members of the bottling line team to discuss the filler-specific Action Plan and to task out each countermeasure on a whiteboard. Resources are allocated to:
| Countermeasure | Task | Task Owner |
|---|---|---|
| Restore Equipment | Initial research on Autonomous Maintenance and 5S | Allen (Supervisor) |
| Restore Equipment | Schedule two (2) hours of planned stop time for 5S | Sarah (Scheduling) |
| Restore Equipment | Take photos of the area prior to 5S | Allen (Supervisor) |
| Restore Equipment | Purchase a full set of filler wear parts | Lea (Stores) |
| Restore Equipment | Train operators on a simple 5S process | Allen (Supervisor) |
| Restore Equipment | Run 5S exercise | Allen (Supervisor) |
| Filler Speed Light | Specify and purchase alert light | Bill (Engineer) |
| Filler Speed Light | Install alert light during planned stop | Bill (Engineer) |
| Setup Marks | Interview operators for current setup marks | Dave (Maintenance) |
| Setup Marks | Identify best settings with operators | Dave (Maintenance) |
| Setup Marks | Implement and test best settings with operators | Dave (Maintenance) |
| Tick Sheet | Design a performance loss reason tick sheet | Amy (Admin) |
| Tick Sheet | Train supervisors and operators to use the new sheet | Amy (Admin) |
| Tick Sheet | Collate sheets each week and present to team | Amy (Admin) |
During the next week the team:
- Cleans, lubricates, and replaces wear parts in the filler.
- Completes a 5S exercise. The team notices that two parts are overworn and should be replaced.
- Identifies that the filler is being run slower than the Ideal Cycle Time because one of the product variants jams at the Ideal Cycle Time. They make a chart showing optimal settings for each product.
- Fills in the tick sheet to collect more information for the next round of improvements.
- Discovers that a critical mechanical component appears close to failure (which would have created at least a day of breakdown time). Mario immediately authorizes a replacement part to be ordered and Sarah schedules time for Dave to carry out the replacement.
Capture What You Learned
What Do We Do?
Each improvement cycle should end with a brief retrospective where you answer three questions:
- What went well?
- What could have gone better?
- What should we change for the future?
The answer to the last question should be captured in standardized work processes. Lock-in any improvements by documenting them as new best practices for your manufacturing operation.
Example
The team agree that they focused on the correct loss, and that the project was organized well. They agreed that they could have used more stop time to do a more thorough job of cleaning and lubricating the filler. They agree to schedule more time for this type of activity in the future.
Allen locks-in what they have learned by updating their standardized work documents. He also makes sure that operators across all three shifts are trained on the improvements. He also talks to Mario about deploying the improvements across the other two bottling lines.
Amy’s tick sheet identifies that a substantial number of small stops are caused by bottle jams and they seem to be mostly occurring with a new bottle they started using several months ago. As a result, the materials purchasing team will be included in the next improvement cycle.
Results
When you manage the inputs (IDA), the Results take care of themselves.
It is actually very liberating to stop obsessing over Results (which are inherently backward-looking) and instead spend your time and energy on creating a process that generates Results: Information, Decisions, and Actions.
Now publish your results. If you got the Result you wanted, celebrate successes. If you didn’t get the Result that you wanted, re-assess how you implemented IDA to identify the weakness in your process (Was the data accurate enough? Did you make the right decisions? Did you align the team to focus on a single loss area? Did you complete all your agreed actions?).
Example
The team at Bubbly Beer reduced performance loss by 416 minutes – recovering nearly seven (7) hours of production time across the three shifts.
This is a great result! Mario is delighted as the improvement has meant that the sales team can bring in two new customer contracts without adding additional cost to the plant.
To celebrate, Mario organizes to stop down production for two hours next week for a catered team picnic. He even organizes a local catering company to bring an outdoor pizza oven so the team can order their own custom-made pizzas!
Evaluate Your IDA Balance
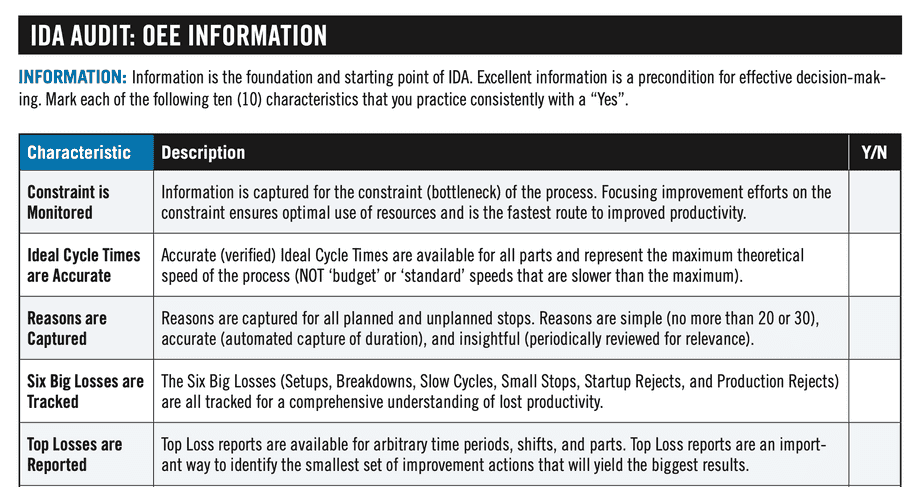
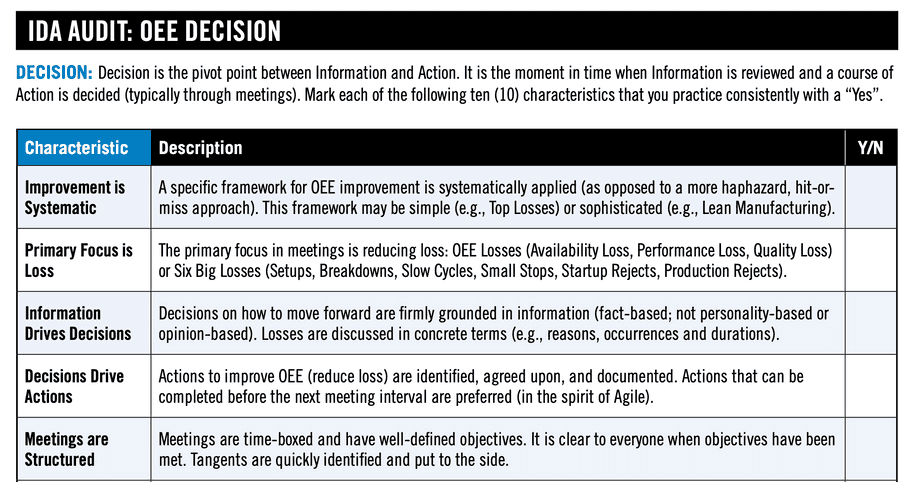
As described earlier, optimal results come from balancing Information, Decision, and Action. For a quick health-check on the effectiveness of your IDA practices, apply the below OEE-based IDA audits. Each OEE-based IDA audit can be downloaded as a PDF document for you to utilize in your factory.
Note: The IDA process was derived from pioneering work by OptimumFX, who are UK-based thought leaders and experts on manufacturing improvement.
WHAT YOU SHOULD DO NEXT...
1. Learn more about how our product, Vorne XL, can help you eliminate waste and significantly improve OEE.
Vorne XL is the simplest and fastest way to monitor and improve production. It's a one-time cost and takes just a day to install. And you can try it completely free for 90 days.
Learn More2. Download our FREE package of tools to supercharge your manufacturing productivity
The package includes leadership lessons, training guides, meeting and report templates, summaries of key concepts, project organizers, and more. You'll also receive our monthly newsletter for free. Unsubscribe at any time.
DOWNLOAD FREE LEAN TOOLS3. Sign up for our monthly newsletter
Get free monthly updates with proven methods for improving our manufacturing productivity. Unsubscribe at any time.

